Sustainability report and key figures
The content on this page was translated automatically.
In its sustainability report, the University of Kassel regularly publishes key figures on central developments in its operations, such as energy consumption and waste generation.
For better comparability, consumption is set in relation to the number of universityemployees and the building area.
Student numbers have risen steadily in recent years.&In 2019, around 25,000 students were enrolledand around 3,400 people were employed in teaching, science and administration.
Contents

Building area
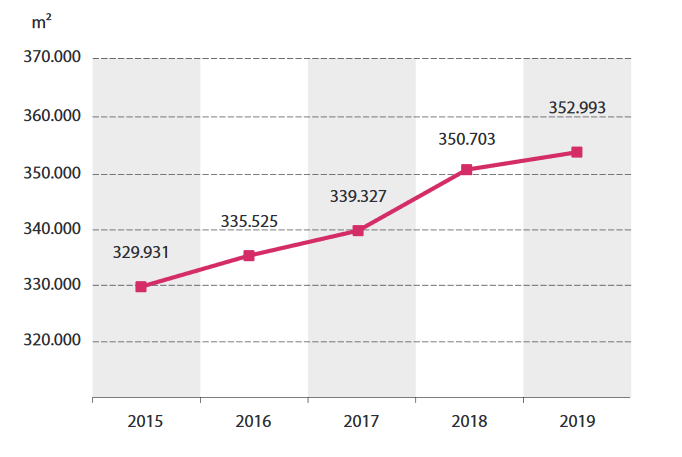
The campus grows
The University of Kassel has been in a phase of growth for many years. Based on the building structure concept drawn up in 2005 and updated in January 2015, the Holländischer Platz campus is being expanded towards the north. As a result, the building area to be managed has grown from 293,940 m² to 352,993 m² net room space (NRF) from 2009 to 2019, i.e. by about 20%.
Energy use
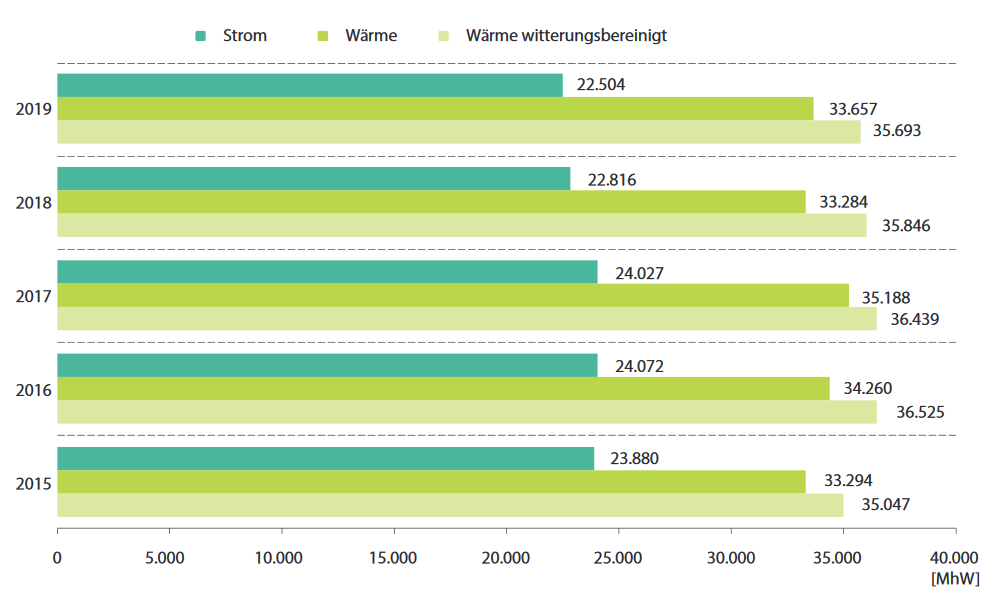
Constant level
Despite an increase in floor space and the number of people, the demand for heatremains at a more or less constant level.
Until 2016, the annual electricityconsumption increased steadily. From 2018 onwards, a downward trend can be observed.
Key figures electricity
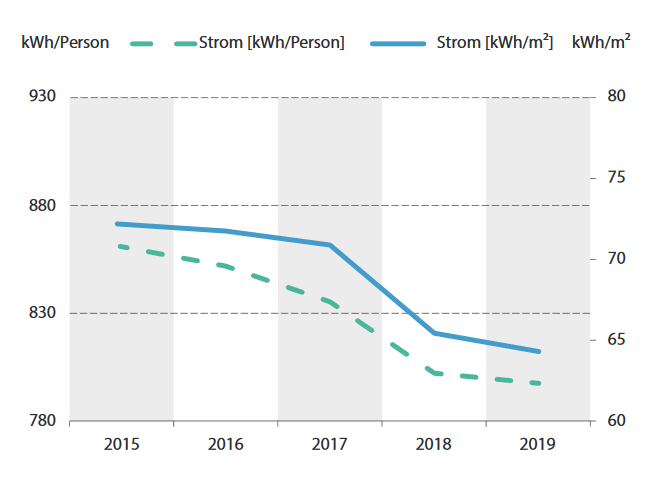
Downward trend
Since 2016, the specific electricity consumption per m² NRF has been significantly reduced, reaching a value of 64 kWh per m² by 2019 (approx. -10%).In terms of university employees, this corresponds to a reduction from 849 to 793 kWh per person (approx. -6.6%).
Key figures heat
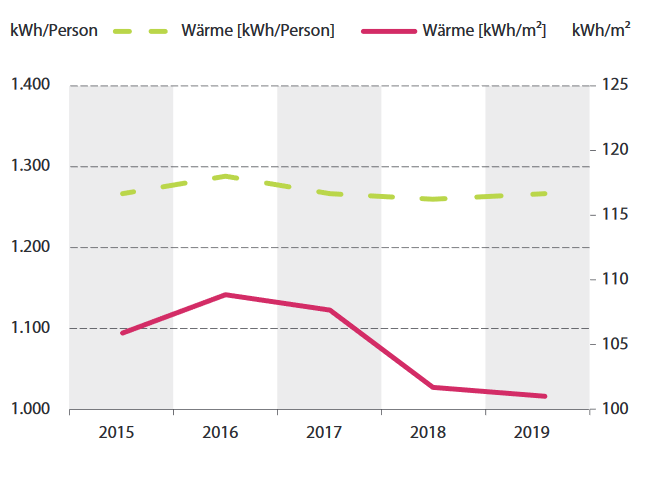
Less demand with more space
Specific heat consumption was reduced by around 7% from 109 to 101 kWh per m² NRF.
In terms of persons, the heat consumption remains at approximately the same level despite increasing building areas and the number of students.
CO2 emissions from the use of heat and electricity
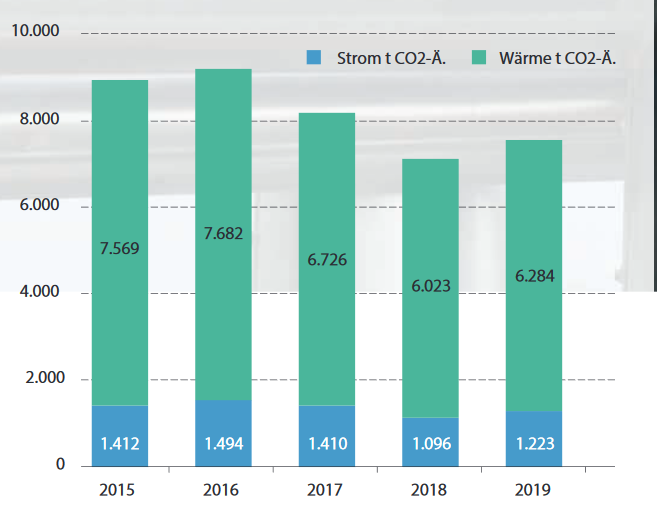
New framework conditions reduce CO2 emissions
In 2016, electricity and heat consumption resulted in a total of 9,176 t CO2-e Co2 emissions. In 2019, the CO2 balance shows a significantly lower value (approx. -18%) of 7,507 t CO2-e as a result of lower electricity and heat consumption as well as a correction of the specific CO2 emission factor* for district heating supply via the public district heating network of the city of Kassel.
*From 2018 onwards, a specific CO2 emission factor according to AGFW FW 309-6: 133 kg/MWh(th) is used + 25 % surcharge for upstream chains; up to and including 2016, the GEMIS value of 201 kg/MWh was used.
CO2 emissions
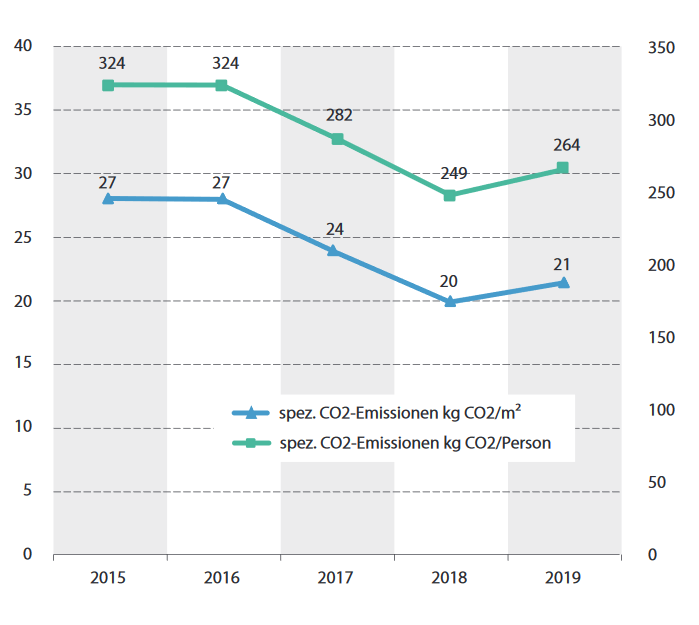
Declining CO2 emissions
In the period 2017 to 2019, the specific CO2 emissions per m² NRF have decreased significantly compared to 2016. Whereas in 2016 they were 27 kg, in 2019 they are only 21 kg per m² NRF.
The specific CO2 emissions per person are also decreasing; if they were 324 kg in 2016, they are only 264 kg per person in 2019.
Waste generation
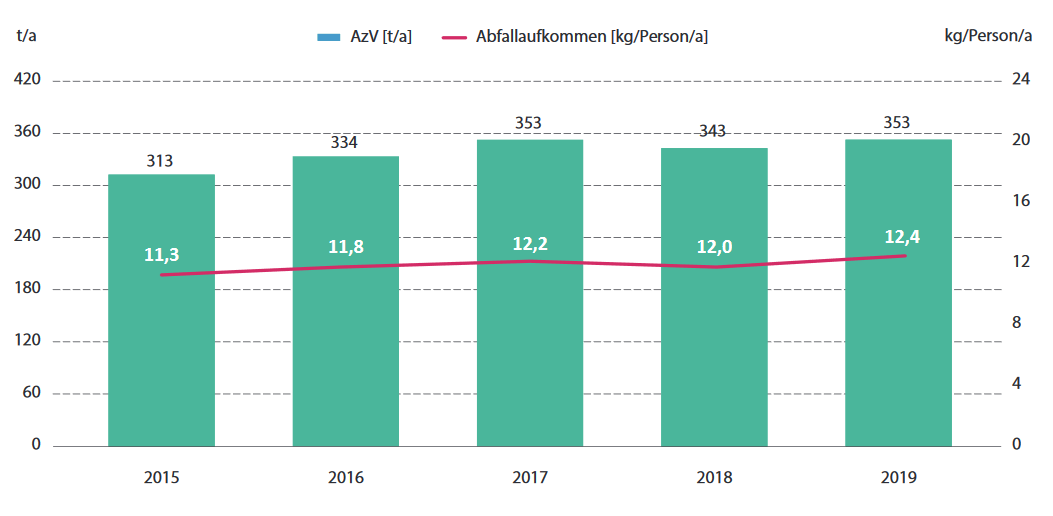
Optimized waste separation
The amount of waste for recycling (AzV) was 334 t in 2016 and has slightly increased in 2019, and was 357 t. Before the introduction of the waste management concept, the amount of AzV was about 380 t per year and 19.1 kg per person. The specific waste generation in 2019 is 12.4 kg per person.
Water consumption
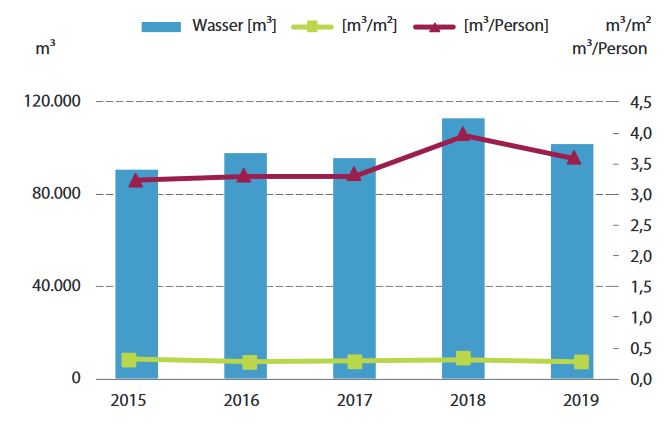
Slight increase in water consumption
Water consumption is subject to slight fluctuations and shows a slight upward trend. From 2016 to 2019, consumption increased from 3.3 to 3.6 m³ per person. To reduce water consumption, water-saving faucets and WC flushes were used at many sites.
Further water-saving measures are planned.